
How to Invest According to an Election: Lessons From the Past Advise Caution
- Abigail Pascua-Matte

- Aug 26, 2025
- 9 min read
Updated: Aug 27, 2025
Disclaimer: The information and opinions expressed in this article are for informational and educational purposes only and is not intended to provide financial advice. The content is based on personal opinion and research and does not take into account the readers’ specific financial situation, risk profile, needs, or objectives. Always consult a licensed financial advisor or a qualified financial professional before making financial decisions.
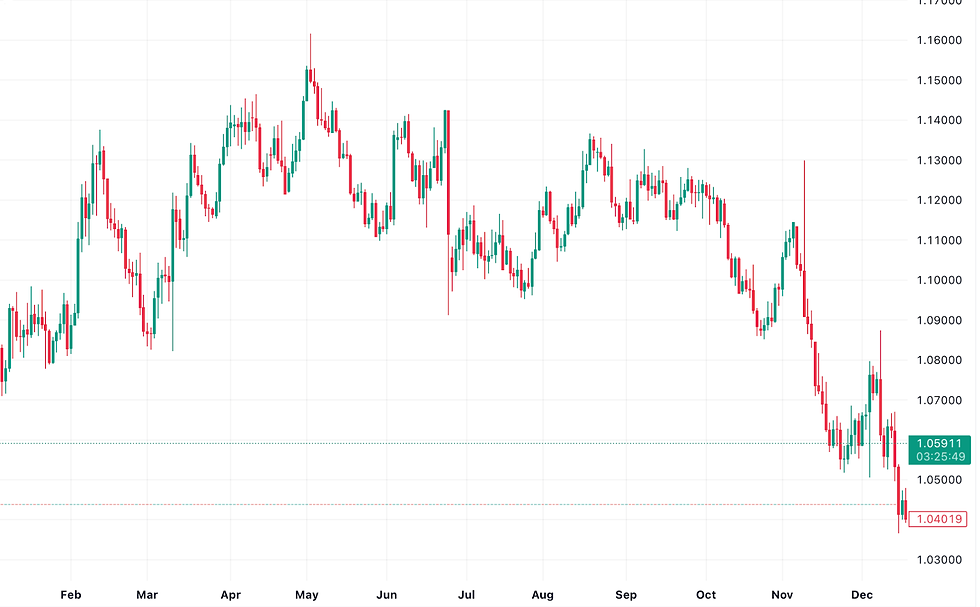
The year 2024 was marked in global politics as the year of elections; Europe witnessed both the French and British elections in June and July respectively, while the US held its election in early November. At the time of writing, Donald J. Trump has just won the presidency complemented by a Republican majority in both the House and Senate. A united Republican trinity gives confidence to many that Trump’s protectionist fiscal policy, promising a 60% tariff on Chinese imports and a blanket 10% tariff on all imports in conjunction with his proposed corporate tax reduction (Tausche, 2024), seems increasingly likely to pass. Reactions have diverged in two opposing directions since Trump’s win: one mired with pessimism as U.S. bond yields steepen and maturity dates elongate (Exhibit 1) (telltale signs by the market of future economic trouble), and the other guided by optimism for the coming four years as the U.S. dollar strengthens and the stock market continues to reach record highs (Exhibit 2,4). With Trump to be inaugurated on January 20th, many investors have picked a side, deciding to allocate their money according to their either hopeful or unfavourable predictions of the next four years. With this trend in mind, this begs the question: Are investors justified in their attempts to capitalize on the results of elections, or are they better off exercising caution and basing their investment decisions on other variables?


History Repeats Itself in the United States
Trump’s 2016 presidential bid was built on a frequently cited large trade deficit between the U.S. and China (Trump, 2016). Trump’s answer to the trade deficit in 2016 consisted of instituting tariffs as high as 45% on Chinese imports and labelling China as a currency manipulator, focusing on an “America First” platform by reducing imports, particularly from emerging markets (Washington Post Staff, 2015). Upon election results, stock markets increased, with the Dow Jones Industrial Average, S&P 500, and NASDAQ increasing by 5%, reflecting investors’ optimism towards Trump’s pro-business platform and corporate tax cuts (Washington Post Staff, 2015). Additionally, the USD rose against other currencies such as the Euro and GBP, signalling global confidence in the American economy (Exhibit 5,6). Over the following two years, however, retaliatory tariffs led to a trade war between China and the U.S., causing volatility in the market. By the end of 2018, the S&P 500 fell nearly 6% since election night, displaying a drop in company valuations despite President Trump’s pro-business policies. Markets experienced a partial recovery in 2019, with Chinese and emerging market equities even seeing record highs (TradingView, 2024c). Finally, the last two years of Trump's first term were marked by the COVID-19 pandemic which generated volatility in all sectors and regions. Ultimately, as Trump's time in office came to a close, Chinese and emerging markets performed among the best segments in contrast to investors' predictions four years earlier that anticipated they would experience a downturn as a result of Trump’s “America First” agenda (TradingView, 2024c). In the end, markets reacted more aptly to Donald Trump's policies during Joe Biden’s tenure, whose platform served as a reversal to Trump’s populism, than during his own time in office; these same segments endured a sharp correction, which they have yet to recover from, under Biden. Donald Trump’s election campaign was built on immense policy promises that evidently resonated with voters, but ultimately did not fully come to fruition. While the stock, currency, and bond markets did react in accordance with the candidate’s campaign platform, in the end, they failed to correctly interpret the politics of Trump's policies.


The Unreliability of Early Polling
Increased wariness should be habitual when attempting to deploy capital according to polling or forecasts. It is seldom that sample data can serve as a reliable prediction. Nevertheless, a generally accepted exception is that of election polling, which is frequently utilized throughout the election cycle. When sample data fails to yield accurate predictions of the observed event, however, the consequences fall on those relying on it. Take the case of the 1992 U.K. general election for example, which saw the Conservative Party achieve a clear victory of 7.5% (Clements, 1993) despite the Labour Party’s lead in the polls by an average of 1.4% (Smith, 2018). The Labour Party focused their campaign on building an equalized taxation framework, proposing high child and pension benefits, increasing personal and Wife’s Earned Income Allowance (WEIA), and suggesting a top tax rate of 50% (Labour Party, 1992). The Labour Party also focused much of their campaign on reducing unemployment through direct investment and financing skill development in high-technology industries, policies that typically produce stimulating effects on the economy. With projections favouring the Labour Party leading up to the election on April 9, 1992, London’s FTSE 100 index rose from £2,493.10 on January 2 to £2,846.50 on April 8, a 14.2% gain, reflecting investor optimism that the Labour Party's victory would stimulate the U.K. economy (Yahoo Finance, 2024). The GBP, on the other hand, opened that year at 1.87 against the USD, later decreasing to 1.77 against the USD during the same period (Exhibit 7). Still within the same time frame, 10-year bond yields decreased from 9.5% to 8.5%, with a harsher decrease occurring throughout the week following the election, and ended on April 16 at 8.0% (Investing.com, 2024). In the year following the election, bond yields rose due to the Conservatives’ withdrawal of the UK from the European Exchange Rate Mechanism and the expectation of future exchange rate cuts. Market activity leading up to the UK general election exemplified investors allocating capital according to predictions and the leading party’s platform, and the consequences that occur when polling data fails to accurately represent the outcome of the election. Investors behaved bullishly, confident that the Labour Party would be victorious and that their efforts to reduce unemployment would therefore be crystallized. Yet, as noted, the Conservatives won despite early predictions, their contrarian platform proving to have a correcting effect on the U.K. bond market and the GBP (Gimpel & Harvey, 1997).

Great Expectations for the Canadian Election
Many may remember the Trudeau Liberals 2015 campaign, in which the Prime Minister was elected on promises of higher investment activity in the infrastructure sector; policies that caused institutional investors to optimistically push the TSE 300 basic materials and infrastructure sectors upward (Exhibit 7). In the month leading up to the election, the CAD was only valued at 1.33 USD/CAD. In the week following the election, however, the CAD appreciated up to 1.30 USD/CAD. This gain reflected optimism in the Canadian economy, likely attributable to Trudeau's stimulus-heavy fiscal policies. Initially, the TSE 300 also saw a small increase, before experiencing corrections due to the unwinding of oil prices (Kirby, 2017) and the CAD declining after the election (Exhibit 8). Generally, the market positively viewed the Liberal Party’s commitment to higher spending and moving away from the previous administration's balanced-budget approach in the lead up to Trudeau taking office. However, not long after, macroeconomic events caused a downtrend in Canadian equities and currency. From 2016-2019, Canada experienced relatively low GDP per capita growth, averaging only 0.8% per year (Clemens et al., 2021), with the Canadian dollar ending the period where it began at 1.30 USD/CAD. This importantly occurred despite predictions at the beginning of the period that the CAD would appreciate against the USD due to stimulus from increased infrastructure spending (Exhibit 8). The TSE 300 increased by 28% from 2016-2019 as well (Statistics Canada, 2023), a performance that seems pitiful in comparison to the S&P 500’s increase of 53% throughout that same period (Macrotrends LLC, 2024c). Equivalently, the French CAC 40 increased 36% (Macrotrends LLC, 2024a), and Hong Kong's Hang Seng Index increased 37% during this time (Macrotrends LLC, 2024b), developments that help frame the underperformance of the TSE in comparison to peer exchanges. Overall, while Canadian equities saw moderate gains, the Canadian equity market largely failed to live up to investor expectations and the CAD displayed an underwhelming performance, especially when compared to the growth of similar economies.


Bringing It Home
For readers of this journal, major elections such as the ones described above may serve as a precursor to Canada’s own upcoming federal election set to occur on October 20, 2025. With incumbent governments fighting off right-wing parties with mixed results, the outlook on Canada's own federal future is unclear. Early polling shows the Conservative Party leading (Grenier, 2024). If accurate, many believe this would result in favourable gains for the Canadian economy, attributable to Pierre Poilievre’s platform of reduced government spending, lower taxation, and pro-business commitments (The Staff, 2022). However, as displayed through the multiple diverse examples illustrated above, it remains exceedingly clear that investment activity simply cannot be modelled according to, nor in contrast to, market speculations based on political programs. Considering that markets are continuing to react in a bullish fashion to the U.S. election, investors would be wise to practise caution when processing financial trends to decide where to devote their finite capital.
References
Clemens, J., Palacios, M., Veldhuis, N. (2021). Trudeau’s pre-recession period marked by weak economic numbers. Fraser Institute. https://www.fraserinstitute.org/article/trudeaus-pre-recession-period-marked-by-weak-economic-numbers
Clements, R., Rallings, C., and Thrasher, M. (1993). General election results, 9 April 1992. House of Commons.
Gimpel, J. G., & Harvey, D. H. (1997). Forecasts and Preferences in the 1992 General Election. Political Behavior, 19(2), 157-175. https://www.jstor.org/stable/586477
Grenier, É. (2024). Poll tracker. CBC. Retrieved November 18, 2024, from https://newsinteractives.cbc.ca/elections/poll-tracker/canada/
Investing.com. (2024). United Kingdom 10-year bond yield historical data [Data set]. Retrieved November 18, 2024, from https://uk.investing.com/rates-bonds/uk-10-year-bond-yield-historical-data
Jowell, R., Hedges, B., Lynn, P., Farrant, G., & Heath, A. (1993). Review: The 1992 British Election: The Failure of the Polls. The Public Opinion Quarterly, 57(2), 238–263. http://www.jstor.org/stable/2749470
Kirby, J. (2017). Tracking Canada’s economy under Justin Trudeau and his father. Macleans.
Labour Party UK. (1992). 1992 Labour Party Manifesto, It's time to get Britain working again. http://www.labour-party.org.uk/manifestos/1992/1992-labour-manifesto.shtml
Macrotrends LLC. (2024a). CAC 40 Index - 27 Year Historical Chart [Data visualization tool]. Retrieved November 18, 2024, from https://www.macrotrends.net/2526/sp-500-historical-annual-returns#google_vignette
Macrotrends LLC. (2024b). Hang Seng Composite Index - 30 Year Historical Chart [Data visualization tool]. Retrieved November 18, 2024, from https://www.macrotrends.net/2526/sp-500-historical-annual-returns#google_vignette
Macrotrends LLC. (2024c). S&P 500 Historical Annual Returns [Data visualization tool]. Retrieved November 18, 2024, from https://www.macrotrends.net/2526/sp-500-historical-annual-returns#google_vignette
Macrotrends LLC. (2024d). Pound Dollar Exchange Rate (GBP USD) - Historical Chart. [Data visualization tool]. Retrieved November 18, 2024, from https://www.macrotrends.net/2549/pound-dollar-exchange-rate-historical-chart
1992 Labour Party Manifesto. (1992). PolticalStuff.co.uk. http://www.labour-party.org.uk/manifestos/1992/1992-labour-manifesto.shtml
Smith, T.M.F. (2018). Public Opinion Polls: The UK General Election, 1992. Journal of the Royal Statistical Society, 159(3), 535-545. https://doi.org/10.2307/2983330
Statistics Canada. (2022). Canadian economic snapshot. https://www150.statcan.gc.ca/t1/tbl1/en/tv.action?pid=1010012501
Statistics Canada. (2023). Toronto Stock Exchange statistics [Data table]. https://www150.statcan.gc.ca/t1/tbl1/en/tv.action?pid=1010012501
Statistics Canada. (2024). Canadian Economic Tracker [Data visualization tool]. Retrieved November 18, 2024, from https://www150.statcan.gc.ca/n1/pub/71-607-x/71-607-x2023022-eng.htm
Tausche, K. (2024). Trump promised massive tariffs on imports but how he’ll pull it off is still being figured out. CNN. https://www.cnn.com/2024/11/08/politics/tariffs-donald-trump-strategy/index.html
The Globe and Mail. (2024). TSX Composite Index [Data visualization tool].
The Staff. (2022). A look into Pierre Poilievre’s key campaign promise as he becomes new Conservative leader. Global News. https://globalnews.ca/news/9120550/pierre-poilievre-campaign-promises/
TopForeignStocks.com. (2014). The FTSE 100 Index Returns by Year [Data set]. https://topforeignstocks.com/indices/the-ftse-100-index-returns-by-year/
TradingView. (2024a). British Pound / U.S. Dollar [Data visualization tool]. Retrieved November 18, 2024, from https://www.tradingview.com/symbols/GBPUSD/?exchange=FX_IDC. [Exhibit 2,4]
TradingView. (2024b). Euro / U.S. Dollar [Data visualization tool]. Retrieved November 18, 2024, from
https://www.tradingview.com/symbols/EURUSD/?exchange=9FX_IDC. [Exhibit 3,5]
TradingView. (2024c). SSE Composite Index [Data visualization tool]. Retrieved November 18, 2024, from https://www.tradingview.com/chart/?symbol=SSE%3A000001
TradingView. (2024d). U.S. Dollar / Canadian Dollar. [Data visualization tool]. Retrieved November 18, 2024, from https://www.tradingview.com/symbols/USDCAD/?exchange=FX_IDC [Exhibit 6,8]
TradingView. (2024e). US Government Bonds 5 YR Yield [Data visualization tool]. Retrieved November 18, 2024, from https://www.tradingview.com/symbols/TVC-US05Y/. [Exhibit 1]
Trudeau, J. (2015). Justin Trudeau, for the record: ’We beat fear with hope’ [Speech transcript]. Macleans. https://macleans.ca/politics/ottawa/justin-trudeau-for-the-record-we-beat-fear-with-hope/
Trump, D. J. (2016). Donald J. Trump delivers groundbreaking contract for the American voter in Gettysburg [Speech transcript]. Democracy in Action. https://p2016.org/trump/trump102216sp.html
Washington Post Staff. (2015). Donald Trump announces a presidential bid [Transcript]. Washington Post. https://www.washingtonpost.com/news/post-politics/wp/2015/06/16/full-text-donald-trump-announces-a-presidential-bid/
Yahoo Finance. (2024). FTSE 100 (^FTSE) [Data visualization tool].


